TLDR: Leverage stats on pbpstats.com group stats based on how each much possession impacts win probability.
Typically when looking at clutch stats in NBA analysis we just do filters based on score margin and time remaining. There is a sizeable difference in win probability between being down 5 with 4 minutes left and down 1 with 4 minutes left. Your percentage chance of winning a game when down 5 with 45 seconds left are in the single digits so lumping this possession with a possession in a tie game with 45 seconds left doesn’t make much sense to me. So while “within 5 points with under 5 minutes to play” is something that is easy to understand, it isn’t necessarily the best measure of how teams or players perform in the possessions that have the most impact on the end result of the game. Because of this I wanted to create a way to calculate the leverage of each possession - how much does the outcome of the possession impact win probability?
This can also act as a garbage time filter by filtering out the lowest leverage possessions. Most garbage time filters filter based on score, time and number of starters on the floor. If teams are slow to pull their starters when a game is out of reach or if a game is a 30+ point game early in the third quarter, those possessions may not meet the garbage time filters even though the result of the game is out of question and both teams may just be going through the motions.
To do this I first needed to build a win probability model. I’m not going to go into great detail on it, but it is a simple neural network that gets the win probability at the start of each possession based on three features: score margin, time remaining in the game at the start of the possession and the implied pre-game win probability based on the moneyline odds. I didn’t spend much time fine tuning the model to be the best model possible because I felt the additional time and effort was unlikely to significantly improve the model.
Once I had the win probability model I needed to come up with a way to calculate how much each possession impacts the overall win probability. We can’t just look how much the win probability changed based on the result of the possession because not all outcomes have the same impact on win probability. It is more appropriate to look at how each possible outcome changes win probability, then weight it by how frequently that outcome occurs. Each possession has 5 possible outcomes: scoring 0, 1, 2, 3 or 4 points (I realize that it is possible to score more than 4 points on a possession, but that happens so rarely that for the purposes of this exercise I’m going not to include those). The specific way I did it is to square the change in win probability (based on the actual time the possession ended), multiply it by the frequency, sum up all these values and take the square root.
Here is an example using real values from the model. If both teams are evenly matched, a team down 2 with the ball with 45 seconds remaining has a win probability of 0.311. Let’s say the possession ends with 30 seconds left. These means there are five possible ways the next possession will start:
- Score 0 points, down 2 with 30 seconds left. Win probability of 0.138. Change in win probability of -0.173.
- Score 1 point, down 1 with 30 seconds left. Win probability of 0.248. Change in win probability of -0.063.
- Score 2 points, tied with 30 seconds left. Win probability of 0.401. Change in win probability of 0.09.
- Score 3 points, up 1 with 30 seconds left. Win probability of 0.596. Change in win probability of 0.285.
- Score 4 points, up 2 with 30 seconds left. Win probability of 0.734. Change in win probability of 0.423.
The frequencies of a scoring each of those number of points are 0.5073, 0.0944, 0.2848, 0.1119 and 0.0016 respectively. Note the model was trained on data from 2012-2020, so these are the frequencies over that time period.
The square root of (-0.173^2 * 0.5073) + (-0.063^2 * 0.0944) + (0.09^2 * 0.2848) + (0.285^2 * 0.1119) + (0.423^2 * 0.0016) is 0.165. This is the leverage value for the possession.
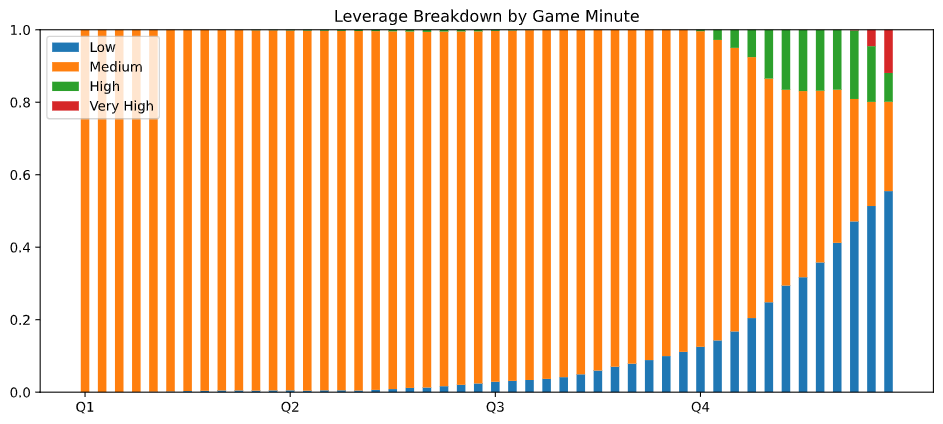
So then what do we do with these leverage values? I wanted to be able to filter for the possessions on both ends of the extreme; the possessions that have no impact on win probability (low leverage values) and the possessions that have a big impact on win probability (high leverage values). To make things easier on the database side of things and help query speed, I bucketed the leverage values into four buckets - low, medium, high and very high, tinkering with the cutoff values to use until I found something that I thought looked reasonable. Below is the breakdown of the frequencies for each leverage bucket by game minute.
Here are a few examples of which buckets some offensive possessions fall into:
- Up 8 with 1:20 left in the 4th: Low
- Up 13 with 3:15 left in the 4th: Low
- Down 24 with 2:18 left in the 3rd: Low
- Up 7 with 2:26 left in the 4th: Medium
- Up 1 with 10:18 left in the 4th: Medium
- Down 4 with 1:29 left in the 4th: High
- Tie game with 6:38 left in the 4th: High
- Down 5 with 7:06 left in the 4th: High
- Down 2 with 0:41 left in the 4th: Very High
- Down 1 with 1:02 left in the 4th: Very High
- Down 2 with 1:36 left in the 4th: Very High
For those interested, the earliest high leverage spots tend to be in situations where a big pre-game betting favourite is losing.
I like that using this model allows us to filter out end of game possessions when both teams still have their starters in but the game is effectively over. These may not be typically considered garbage time possessions.
To find stats for these leverage buckets you can go pbpstats.com , go to Totals and select one of Player/Team/Opponent/Lineup/Lineup Opponent, then under the Leverage dropdown select one or more options.
Is this a better way to look at clutch stats and garbage time stats? I don’t know, but I think the overall idea makes more sense.
Sources:
- A Simple Neural Network for In-Game Win Probability Modeling of NCAA Basketball Games
- Crucial Situations
- NBA In-Game Win Probability
- NBA Win Probability - Take Two